
Of all U.S. food expenditures went toward food prepared away from home.
43.7% At home
That represents approximately $1.41 trillion spent on prepared meals and snacks, compared with $1.10 trillion on food at home, measured in 2025 dollars.
This is rather extraordinary. We’ve reached a point where paying someone else to prepare food accounts for the majority of the country’s food spending.
And with restaurant prices continuing to climb faster than grocery prices, the financial consequences deserve far more attention.
Restaurants Now Command the Majority of America’s Food Spending
The USDA’s foodservice industry data show how dramatically the American food economy has changed.
Here’s how total food expenditures were divided in 2025:
| Food category | Share of spending | Total spending |
|---|---|---|
| Food away from home | 56.3% | $1.41 trillion |
| Food at home | 43.7% | $1.10 trillion |
| Total | 100% | $2.51 trillion |
Source: USDA Economic Research Service. Spending amounts are expressed in 2025 dollars; percentage shares are calculated from nominal expenditures.
Bank of America has also examined Americans’ growing appetite for dining out. Its aggregated card data provides another perspective on how restaurant spending compares with other food categories.
Food-away-from-home spending first overtook spending on food at home in 2004. The pattern has persisted for more than two decades, with a temporary disruption during the pandemic. Restaurants dominate this market.
In 2025, limited-service restaurants accounted for 36.5% of food-away-from-home expenditures, while full-service restaurants represented another 34.5%. Together, those two categories captured 71% of the money spent on food away from home.
Restaurant Share of Food-Away-From-Home Spending
Combined share of limited-service and full-service restaurants in 2025.
The remaining 29% included spending at other foodservice establishments, such as hotels, cafeterias, and institutional dining facilities.
The concern is how thoroughly prepared food has become embedded in everyday spending. Coffee on the way to work, lunch between meetings, dinner picked up after a long day, and delivery on the weekend can collectively become one of a household’s largest flexible expenses.
The individual transactions seem manageable. Their annual total can be startling.
What the 56.3% Figure Actually Measures
There’s an important detail in the USDA’s calculation. Its Food Expenditure Series measures food spending across the broader economy, including food acquired by households, businesses, and government entities.
Food away from home includes prepared meals and snacks purchased at restaurants, fast-food establishments, cafeterias, hotels, and other foodservice locations. The national estimates also account for food furnished in certain institutional settings.
Household spending surveys provide another perspective. According to the Bureau of Labor Statistics, the average American consumer unit spent $10,169 on food in 2024.
Of that amount:
- $6,224 went toward food at home, approximately $519 per month.
- $3,945 went toward food away from home, approximately $329 per month.
That means food away from home accounted for approximately 39% of the average consumer unit’s food expenditures in the 2024 survey.
Important Distinction
The USDA and BLS figures cover different populations, spending categories, and years. They answer different questions about the nation’s relationship with food.
Using the national 56.3% figure to accuse every household of excessive restaurant spending would be careless. The household figures offer a much better starting point for personal budgeting.
And even at 39%, the amount going toward prepared meals is substantial.
Americans Are Paying a Premium for Convenience
The expansion of restaurant spending makes sense when you consider how Americans organize their days.
Cooking requires shopping, planning, preparation, cleaning, and enough time to complete those tasks. Prepared food removes much of that work.
Restaurants charge for the ingredients, employees, equipment, rent, utilities, and the service required to deliver a finished meal. Customers ultimately pay for those operating costs.
Generally speaking, the modern food economy has become remarkably effective at monetizing exhaustion.
A family arriving home at 7 p.m. may happily pay $45 for takeout because preparing dinner feels impossible. A worker with 30 minutes for lunch may spend $16 on a meal that could be assembled at home for considerably less.
View this post on Instagram
These decisions are understandable. The problem emerges when they become automatic.
Convenience deserves a place in a household budget. But it should have a price limit.
Households that frequently purchase prepared food should evaluate those expenses with the same seriousness they apply to groceries, insurance, and utility bills.
For a comparison of home-prepared food costs, we’ve previously examined average monthly grocery costs by household size. Those estimates help establish the cost of feeding a household before adding restaurants and delivery.
Restaurant Prices Are Rising Faster Than Grocery Prices
The growing reliance on prepared food becomes especially concerning when we examine inflation.
According to the September 2026 Consumer Price Index report, food-away-from-home prices increased 3.5% over the preceding 12 months.
Food-at-home prices increased 1.8% during the same period. Restaurant prices were rising at nearly twice the rate of grocery prices.
Food Price Inflation | September 2026
3.5%
1.8%
Percentage changes over the preceding 12 months. Bars use a common 0% to 4% scale.
That’s a serious problem for anyone relying heavily on takeout or restaurant meals to get through the week. It also changes how we evaluate food inflation.
Americans spend considerable time discussing expensive eggs, meat, coffee, and other supermarket products. Restaurant meals deserve at least as much scrutiny in conversations about rising household food costs.
The restaurant industry has captured an enormous share of American food spending. Consumers should be increasingly demanding about the value they receive.
Paying $20 or $25 for an ordinary meal should prompt a genuine assessment of whether the convenience justifies the expense.
Two Takeout Lunches a Week Can Make a $1,248 Difference
Consider a simple example. Suppose someone buys lunch twice each week for $18 per meal. A comparable lunch prepared at home costs $6 in ingredients.
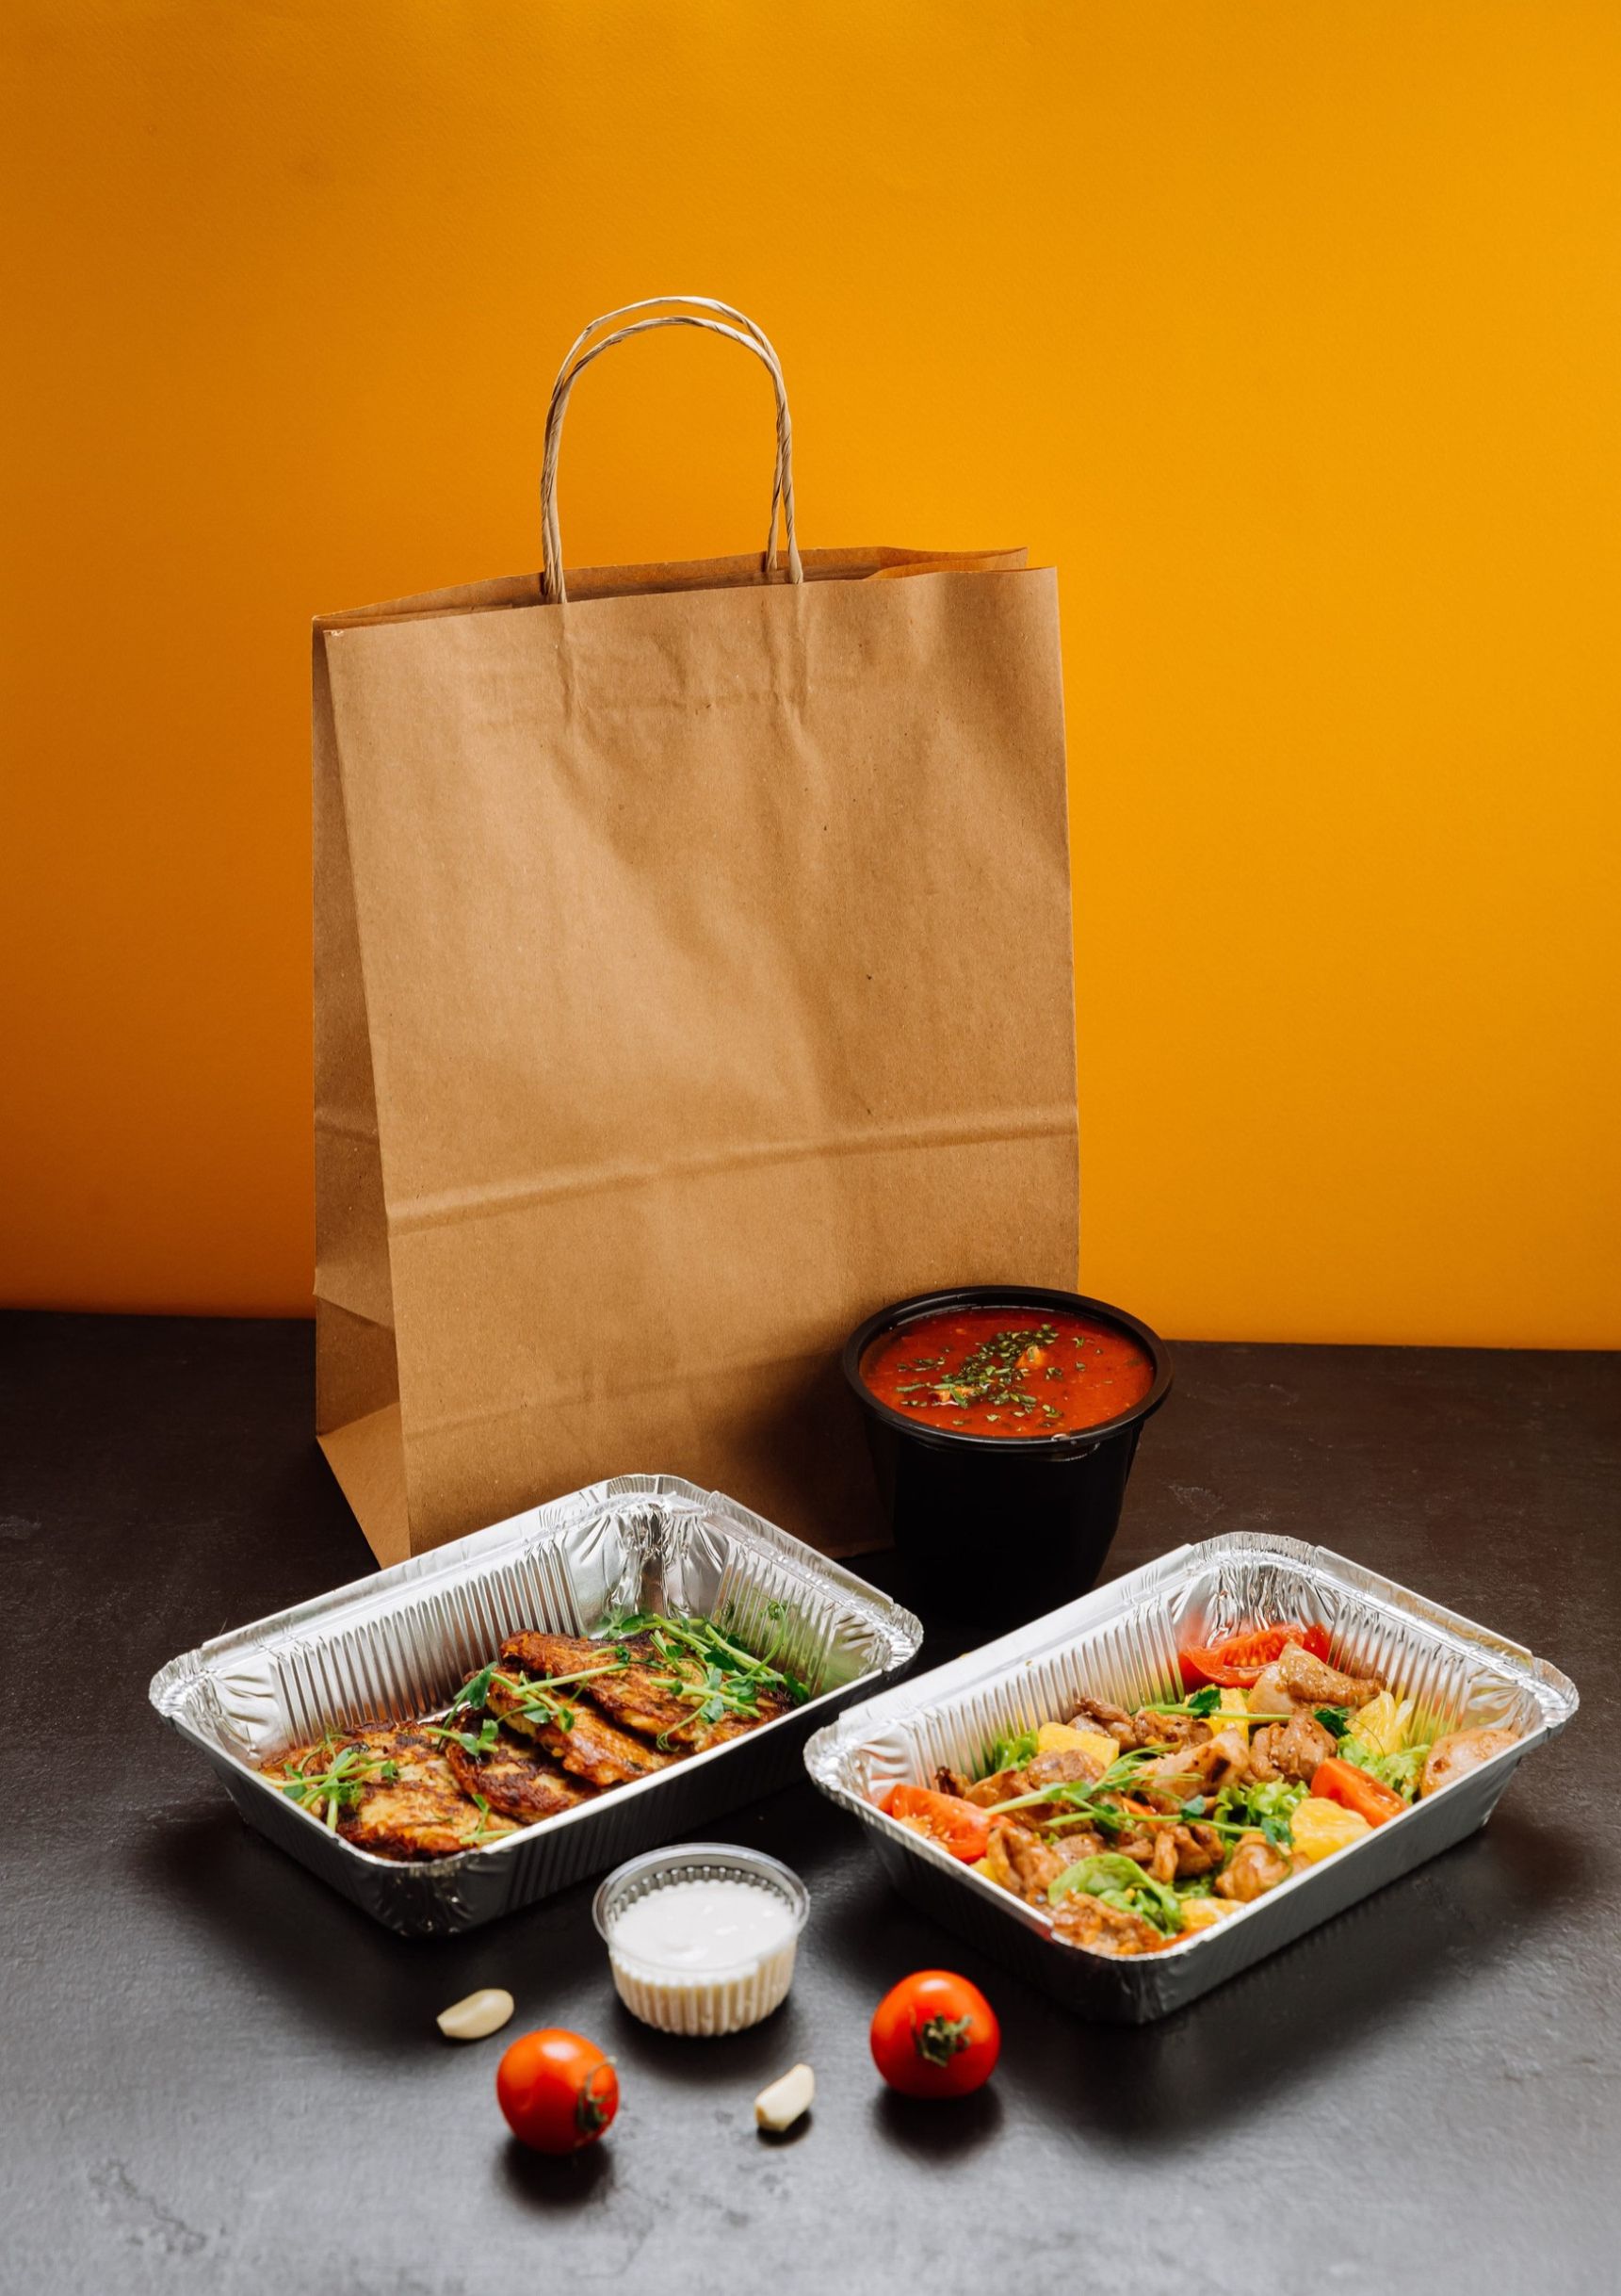
That’s a $12 difference per lunch. Replacing those two purchased lunches each week produces the following potential savings:
| Period | Potential savings |
|---|---|
| One week | $24 |
| One month (average) | $104 |
| One year (52 weeks) | $1,248 |
Illustrative calculation based on assumed meal costs. Actual savings depend on restaurant prices, ingredients, food waste, and the number of lunches replaced.
By replacing just two $18 takeout lunches per week with $6 home-prepared meals.
That $1,248 could make a meaningful contribution toward an emergency fund, debt repayment, or another financial priority.
And the example involves changing just two meals each week.
You should start by identifying the restaurant purchases that have become routine. Those are usually the easiest expenses to reconsider because there’s already an established pattern.
For families, the potential savings can be even larger. Our breakdown of the average grocery bill for a family of four provides useful benchmarks for planning meals at home.
The Real Problem Is How Easily Convenience Becomes a Fixed Expense
There’s a broader lesson in these spending figures.
American households have increasingly incorporated prepared food into their regular routines. Restaurants have responded by making purchasing meals faster, easier, and more accessible.
And the industry’s success is reflected in the enormous amount of money flowing toward foodservice establishments.
Households need to become much more deliberate about how often they’re paying someone else to prepare their meals.
That doesn’t require preparing every meal from scratch. Frozen foods, rotisserie chickens, ready-to-eat supermarket products, leftovers, and simple meals can provide convenience at a lower cost than frequent restaurant orders.
Time has value, and so does money. A household should decide deliberately how much of one it’s willing to exchange for the other.
The most expensive restaurant habit is the one that no longer feels like a financial decision. America’s $1.41 trillion prepared-food market shows just how profitable that habit has become.
For individual households, the question is whether the convenience they’re buying is still worth what they’re paying.